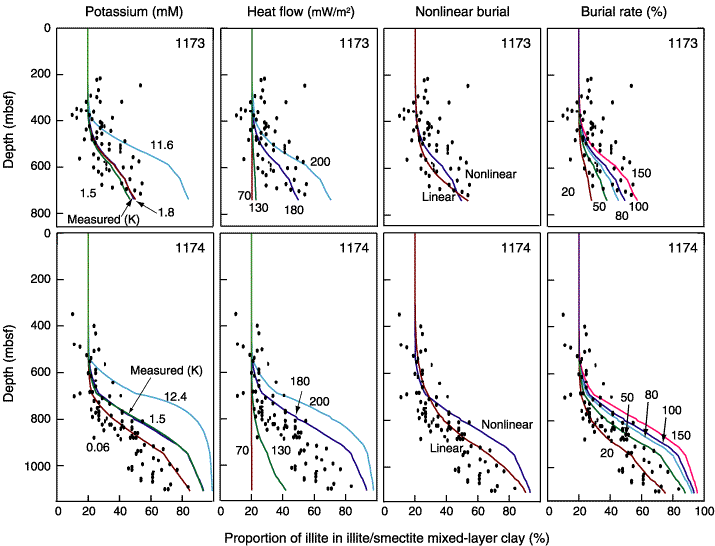
Figure F8. Results of sensitivity analysis for the smectite-illite kinetic model at Sites 1173 and 1174 (see Fig. F6). Solid symbols = measured values of percent illite in mixed-layer clay. Variations in heating time were simulated by taking specified percentages (20%, 50%, and 80%) of the actual depositional age at each sample depth (Table T3). Linear burial curves are based on total depth at each site divided by maximum age.


![]()