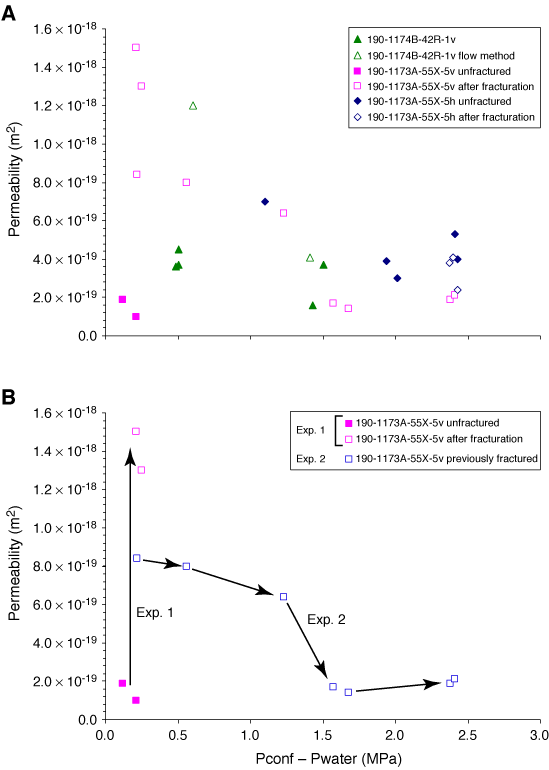
Figure F2. A. Permeability values as a function of the effective pressure for the four experiments. B. Permeability and effective pressure paths for experiments 1 and 2 on Sample 190-1173A-55X-5, 135–150 cm (vertical). v = vertical, h = horizontal. Pconf = confining pressure, Pwater = pore pressure.


![]()