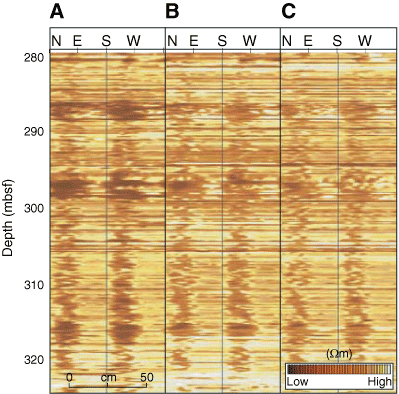
Figure F6. Static normalized resistivity-at-the-bit image within trench fill deposits above the frontal thrust in Hole 808I (from McNeill et al., 2004). Borehole breakouts are the two dark stripes of low resistivity 180° apart, representing borehole elongation in the direction northeast-southwest ( 2). Three images represent formation resistivity (A) 1, (B) 3, (C) 5 in from borehole. Deformation decreases away from the borehole. The maximum principal stress (
 1) would be oriented northwest or 90° from the orientation of the maximum breakout direction.


![]()