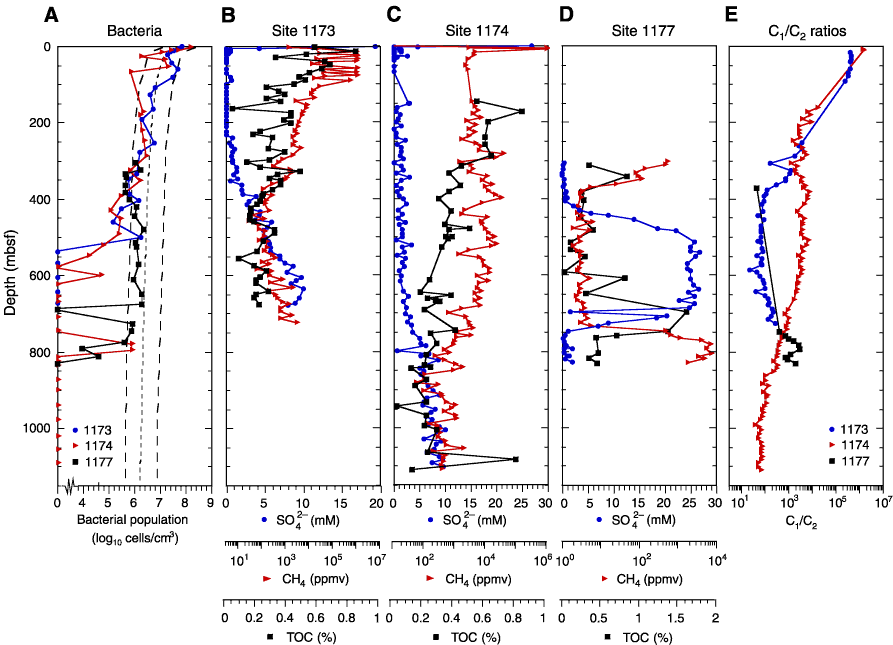
Figure F42. Biogeochemical profiles in sediments from Nankai Trough sites (Leg 190). A. Total bacterial populations at Sites 1173, 1174, and 1177. The dashed curve represents a general regression line of bacterial numbers vs. depth in deep-sea sediments (Parkes et al., 1994), with 95% upper and lower prediction limits shown by large dashed curves. B-D. Sulfate, methane, and total organic carbon depth profiles for Sites 1173, 1174, and 1177, respectively. E. C1/C2 ratios for Sites 1173, 1174, and 1177.
![]()