![]() Figures F1-F13
Figures F1-F13
![]() Tables
T1-T6
Tables
T1-T6
F1. Diagram illustrating core, section, and sample numbering.
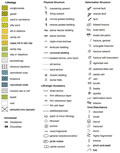
F2. Graphic patterns and symbols used on AppleCORE barrel sheets during Leg 190.
F3. Examples of X-ray diffractograms showing diagnostic peaks.
F4. Layout of the structural description sheet.
![]()
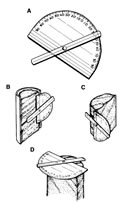
F5. Protractor-goniometer used for measuring orientations of structures in the cores.
F6. Core reference system used during Leg 190.
F7. The gas permeameter used during Leg 190.
F8. Biostratigraphic event zonal markers.
F9. Paleomagnetic coordinate systems of ODP cores and discrete samples.
F10. Magnetostratigraphic timetable used during Leg 190.
F11. Leg 190 wireline tool strings.
F12. Diagram of the dipole shear sonic imager.
F13. Diagram of the Formation MicroScanner.
T1. Normalization factors for bulk-powder samples.
T2. Measured weight percentages of minerals.
T3. Linear regression equations and correlation coefficients in standard mineral mixtures.
T4. Important calcareous nannofossil datums.
T5. Leg 190 wireline tool strings.
T6. Tool-string and measurements acronyms.