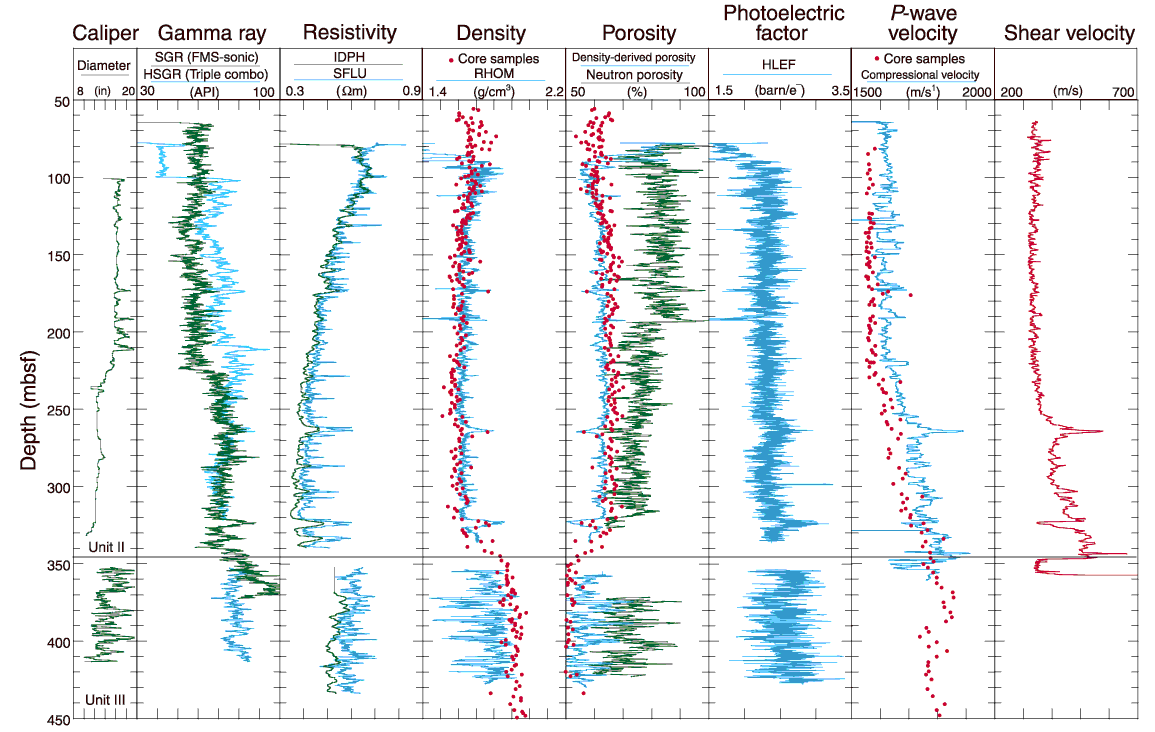
Figure F43. Hole 1173A summary plot of logs and selected core physical properties data for comparison. HSGR spectral gamma-ray data were collected with the triple-combo tool string, whereas SGR data were collected with the FMS-sonic tool string; both are included for comparison and depth ties. See Table T6 in the "Explanatory Notes" chapter for definitions. Circles in porosity column represent porosity measured on discrete core samples.

![]()