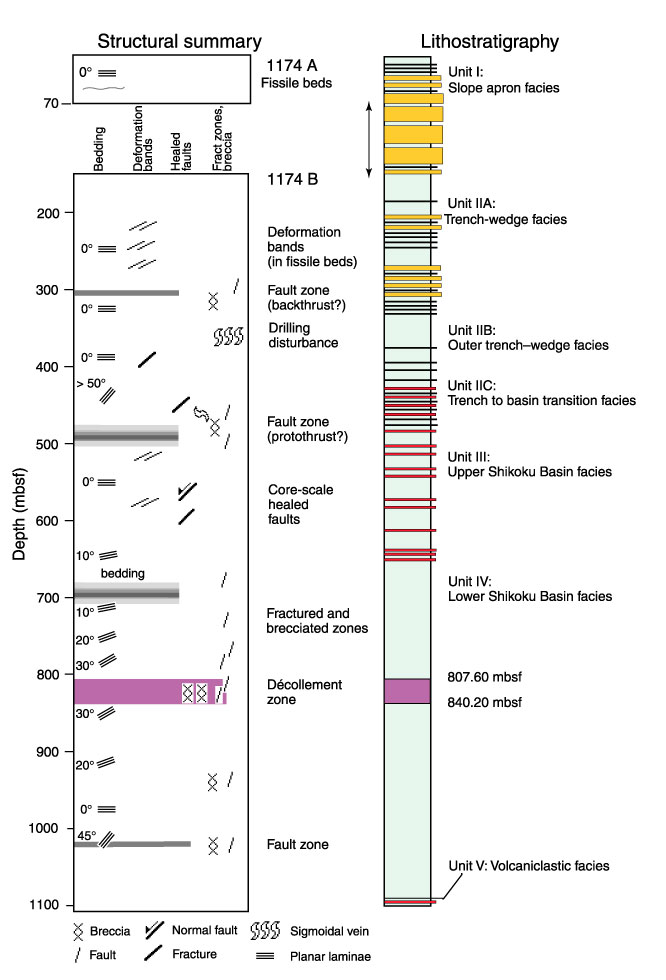
Figure F11. Overall distribution of deformation structures with depth compared with lithostratigraphic divisions. The shaded bands indicate possible fault zones.