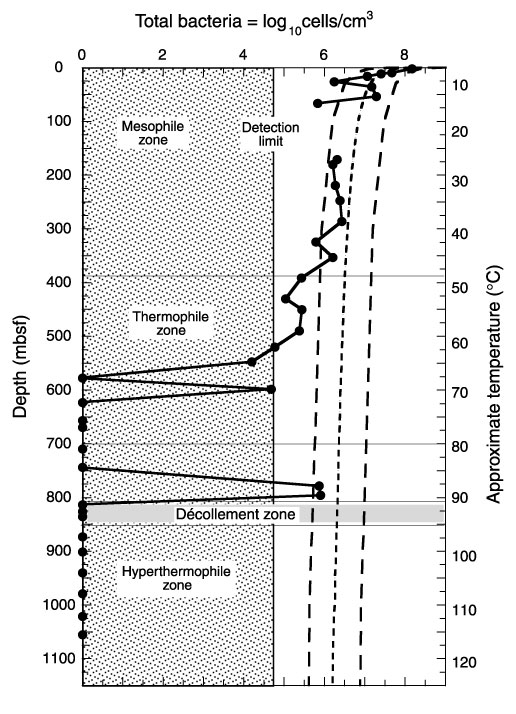
Figure F37. Depth and temperature distribution of total bacterial populations in sediment samples from Holes 1174A and 1174B. The curved dashed line represents a general regression line of bacterial numbers vs. depth in deep-sea sediments (Parkes et al., 1994), with 95% upper and lower prediction limits shown by the curved lines of longer dashes. The shaded area to the left of the figure indicates levels where bacterial populations are too low to be detected with the acridine orange direct counts technique; the detection limit was 6 × 10⁴ cells/cm3 (any values within this area are constructed from sums of three enumerations and have no measure of error). The two horizontal lines separate bacterial groups with different temperature ranges for growth.
![]()