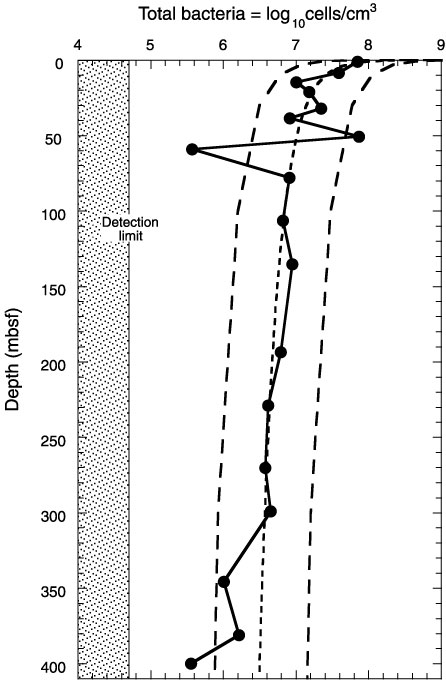
Figure F22. Depth distribution of total bacterial populations in sediment samples from Hole 1175A. The curved dashed line represents a general regression line of bacterial numbers vs. depth in deep-sea sediments (Parkes et al., 1994), with 95% upper and lower prediction limits shown by the curved lines of longer dashes. The shaded area to the left of the figure indicates levels where bacterial populations are too low to be detected with the acridine orange direct count technique. The detection limit was 6 × 10⁴ cells/cm3.
![]()