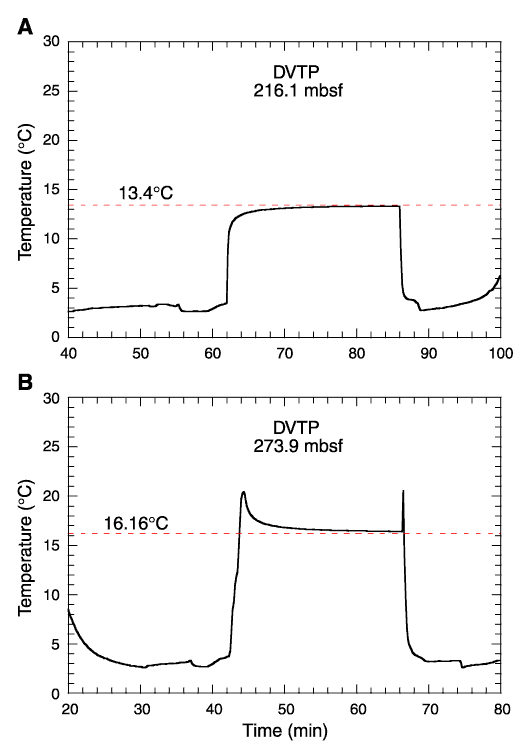
Figure F32. Temperatures measured in Hole 1175A during the DVTP stations (A) after Core 190-1175A-23X and (B) after Core 190-1175A-29X. Dashed lines = extrapolated in situ temperatures.