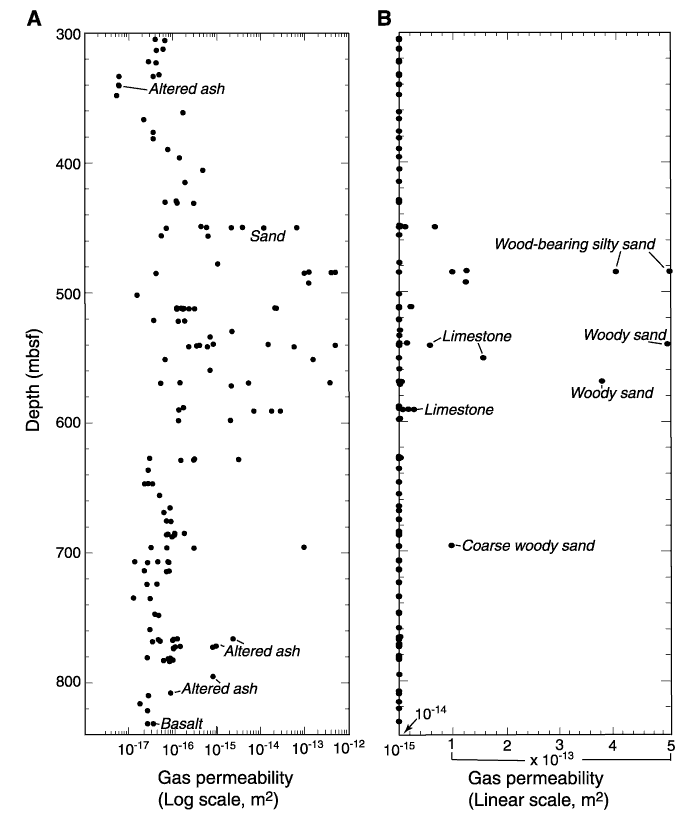
Figure F14.
Gas-permeameter data from Site 1177 plotted (
A
) logarithmically and (
B
) linearly.