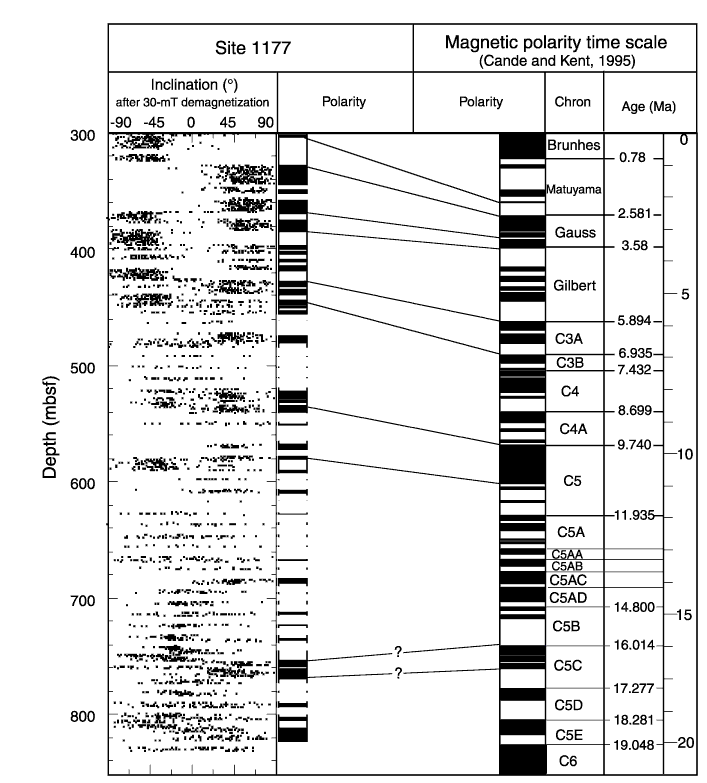
Figure F16. Site 1177 magnetostratigraphy. Detailed comparison of polarity changes with the polarity time scale of Cande and Kent (1995) was difficult because of poor core recovery below 450 mbsf. Black = normal polarity, white = reversed polarity, dashed lines = possible correlations based on biostratigraphic results.

![]()