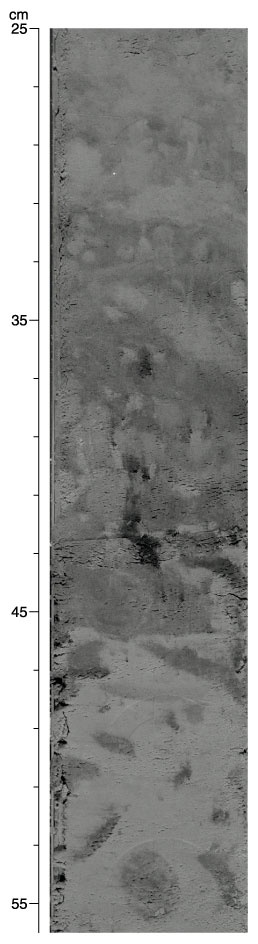
Figure F16. Close-up photograph showing the vertical distribution pattern of bioturbation of Unit I that resembles tiering (interval 191-1179C-9H-4, 25-56 cm).