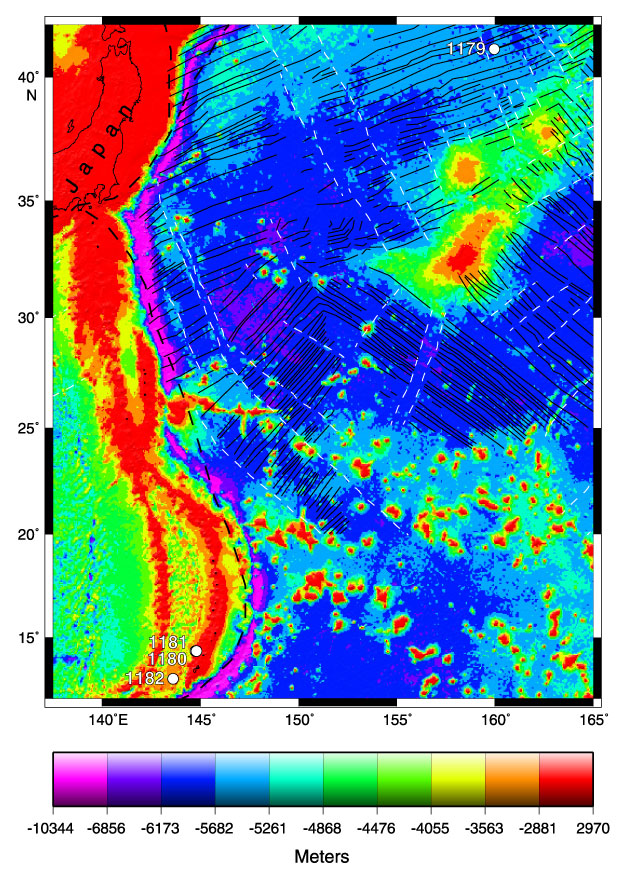
Figure F2. Locations of Leg 191 drill sites in the western Pacific. The chart shows predicted topography (Smith and Sandwell, 1997) and magnetic lineations (compiled from Nakanishi et al. [1989] and the PLATES Project [1998]). White dashed lines = fracture zones, black dashed lines = plate boundaries. The figure was generated using Generic Mapping Tools software (Wessel and Smith, 1995).
![]()