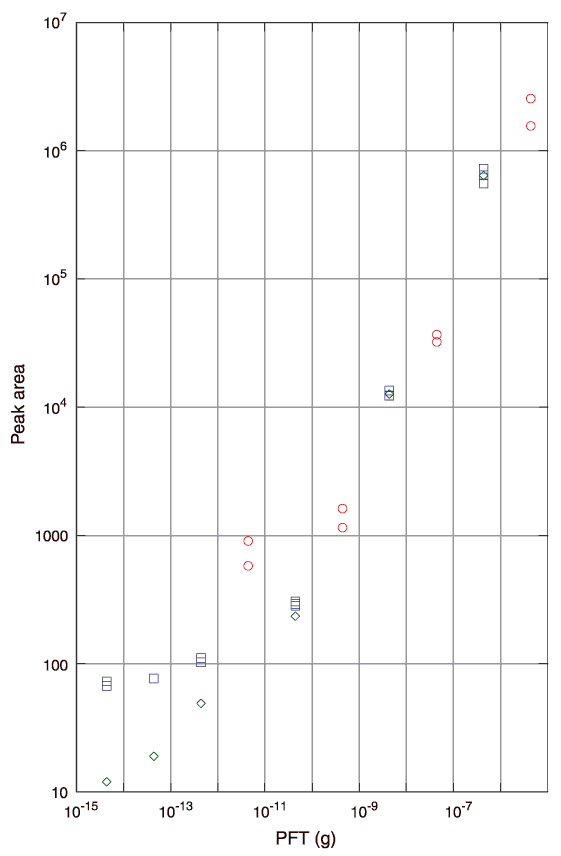
Figure F29. Standard log-log curve of PFT concentration vs. GC peak area using an electron capture detector. Two separate curves are generated from the injection of both 5-mL (circles) and 0.5-mL (diamonds and squares) volumes of perfluorocarbon tracer (PFT) standards onto the capillary column. The nonlinear effect that results from not correcting for the methanol blank at lower PFT concentrations during 0.5-mL injections is shown separately (squares).

![]()