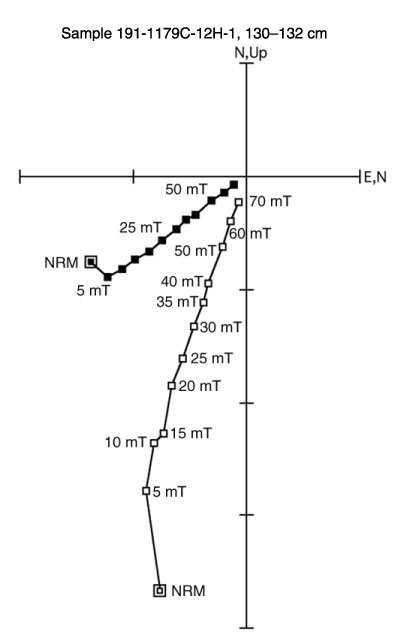
Figure F32. Zijderveld plot of Sample 191-1179C-12H-1, 130-132 cm. Open symbols = the vertical projections onto the up-north plane, closed symbols = horizontal projections onto the north-east plane.