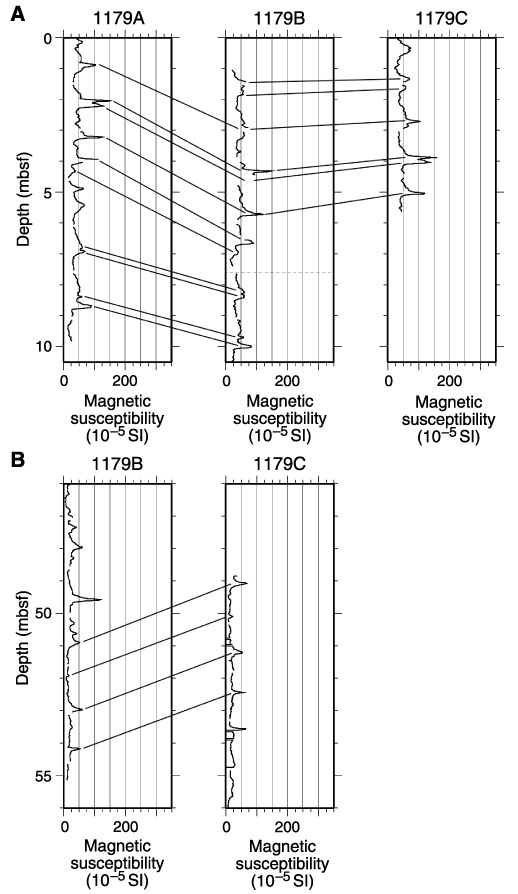
Figure F34. Magnetic susceptibility correlations. Data gaps occur at section and core boundaries. A. Correlations between Cores 191-1179A-1H, 191-1179B-1H and 2H, and 191-1179C-1H. Dashed line = the boundary between Cores 191-1179-B-1H and 2H. B. Correlations between Cores 191-1179B-6H and 191-1179C-2H.
![]()