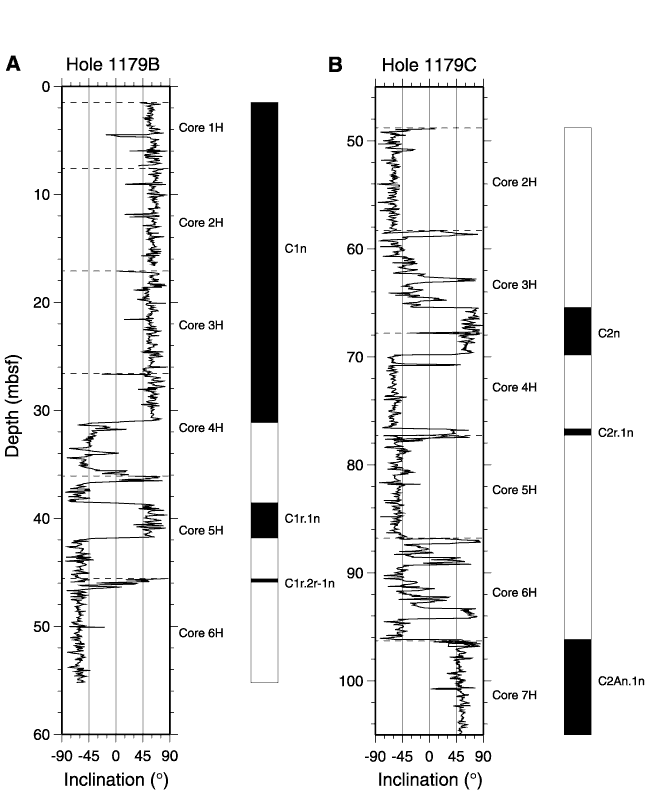
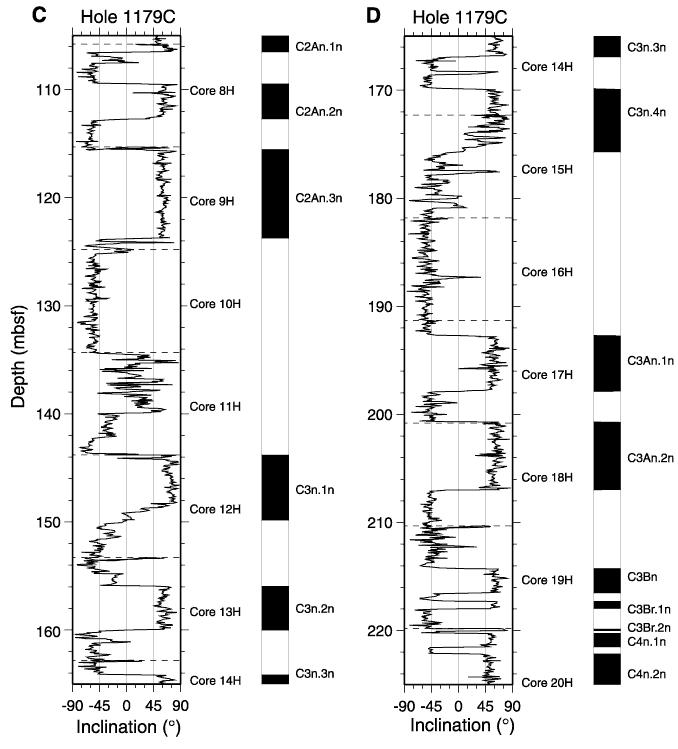
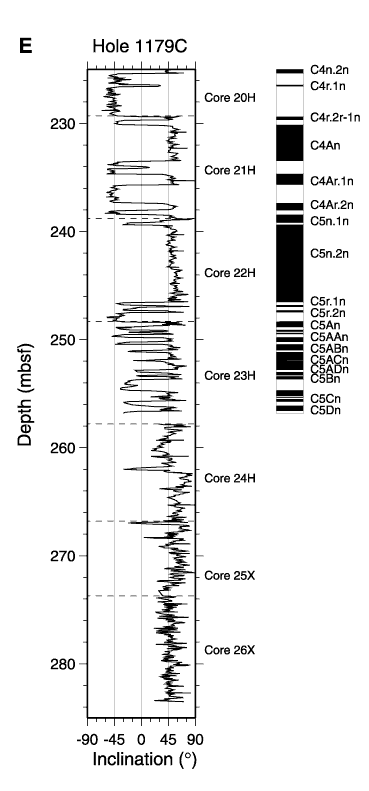
Figure F35. Magnetic polarity reversal sequence (inclination after 40-mT AF demagnetization) vs. depth from the pass-through magnetometer. The dashed lines indicate the locations of core tops. A. Hole 1179B (0-55.2 mbsf). B. Hole 1179C (48.85-105 mbsf). C. Hole 1179C (105-165 mbsf). D. Hole 1179C (165-225 mbsf). E. Hole 1179C (225-283.49 mbsf). Magnetostratigraphy ends at the bottom of Core 191-1179C-23H. Black bands = normal polarity, white bands = reversed polarity.


![]()