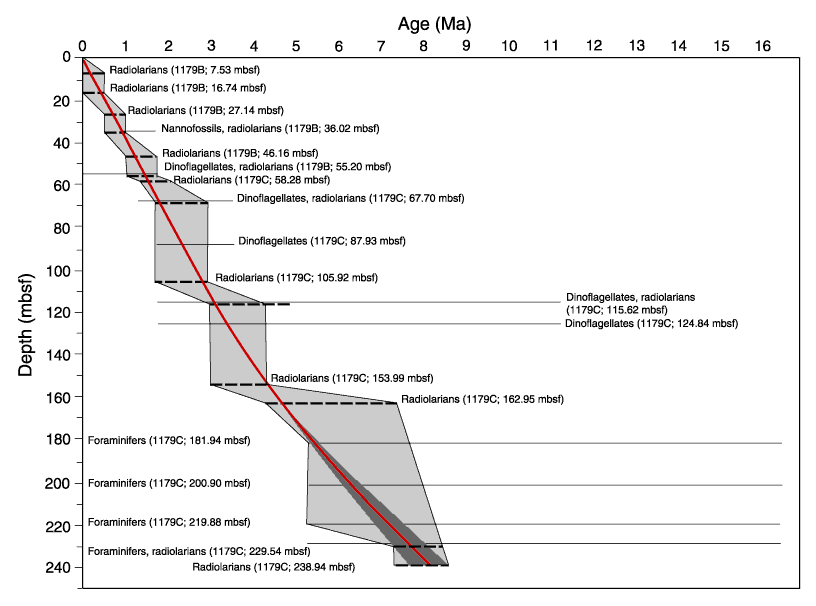
Figure F38. Sedimentation rates based on radiolarians (heavy dashed lines), dinoflagellate cysts, benthic foraminifers, and calcareous nannofossils. Minimum and maximum ages for each sample constrain sediment accumulation rates and are shown as shaded areas; a best-fit sedimentation rate curve was fitted through the shaded region, with uncertainty represented by the darker gray wedge.

![]()