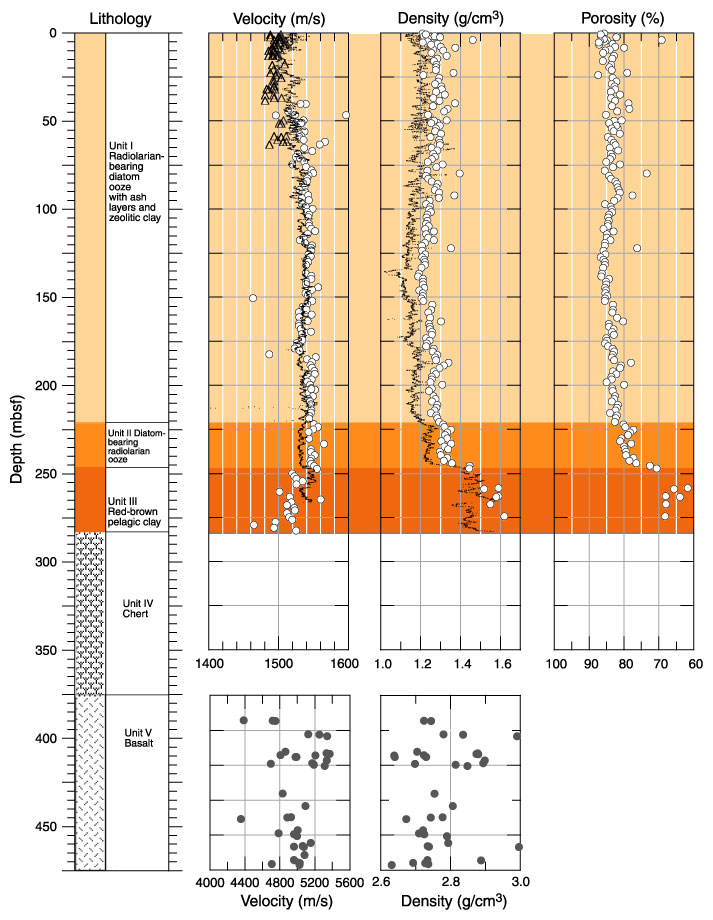
Figure F57. Variations of P-wave velocity, bulk density, and porosity with depth. Discrete sample data are shown by open symbols; a 19-point median filter was applied to the MST velocity and GRA density profiles.