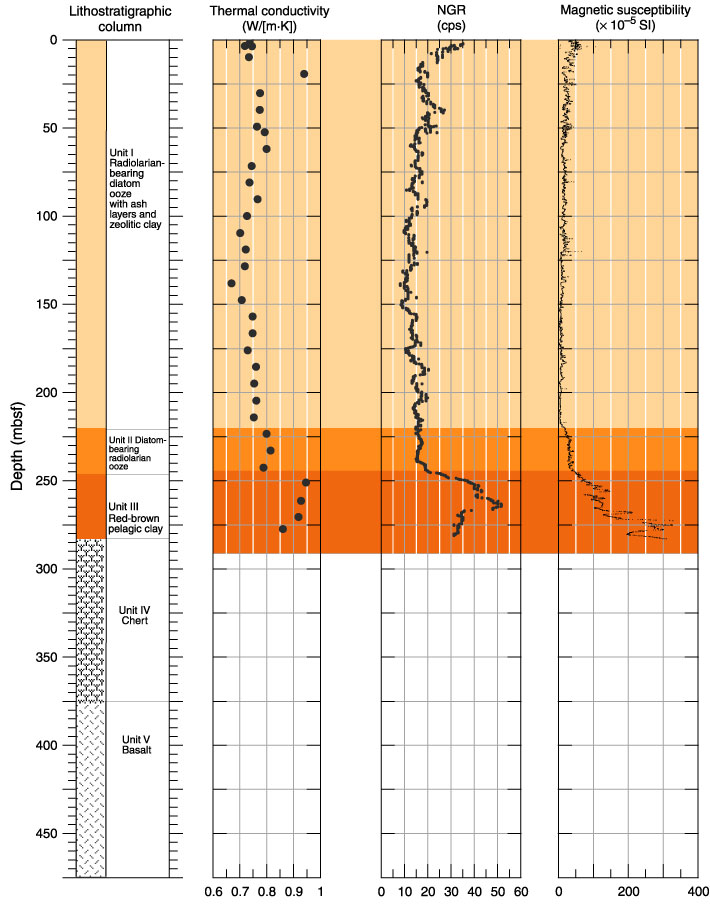
Figure F58. Variations of thermal conductivity, natural gamma radiation (NGR), and magnetic susceptibility (MS) with depth. Discrete sample data are shown by open symbols; a 19-point median filter was applied to the NGR and MS profiles.