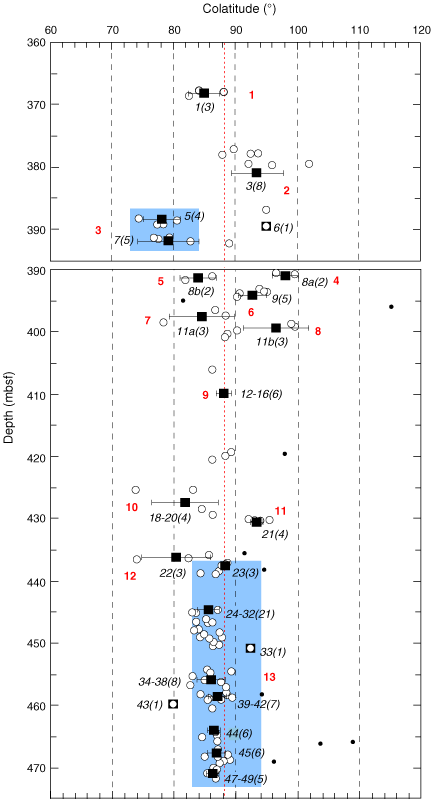
Figure F4. Measured colatitudes and flow mean colatitudes plotted vs. depth in Hole 1179D. The break in the depth column is a result of a depth curation problem that caused the bottom of one core to plot beneath the top of the next core below (see "Discussion"). Open circles = individual sample colatitude values used in the calculation of flow means, dots = sample colatitudes that were considered to be outliers and discarded from calculations, solid squares = average colatitudes for 23 statistically distinct flow groups. Horizontal lines through these symbols = the standard deviation of the flow mean colatitude, italicized numbers with each mean colatitude symbol = the flow number and number of samples used to calculate that mean (the latter in parentheses), bold red numbers give the flow groupings considered to represent independent magnetic units (Table T2). Blue shaded areas show colatitudes that were averaged in computing the 13 independent units. The red vertical dotted line shows the calculated mean site
colatitude.


![]()