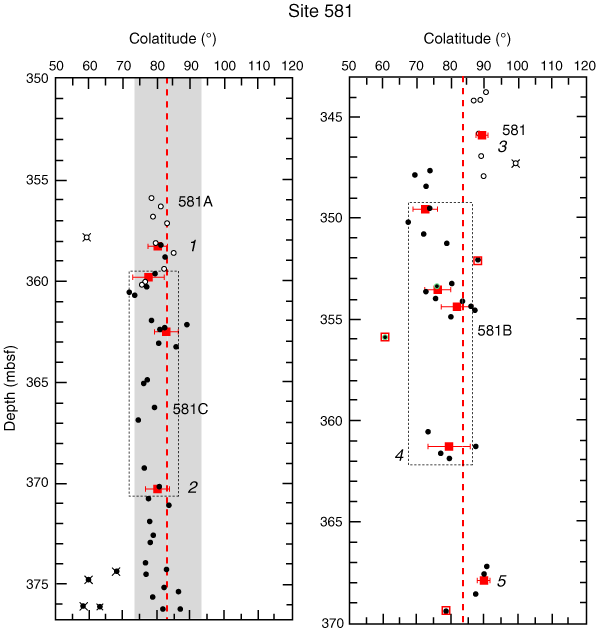
Figure F3. Colatitude data for Site 581. Left plot: open symbols = Hole 581A, solid symbols = Hole 581C. Right plot: open symbols = Hole 581, solid symbols = Hole 581B. Open red squares = three samples, which are the only samples from each respective flow and appear to be statistically distinct from neighboring flows. As discussed in the text, these three data points were not used in determining the site mean. Dotted boxes = group means combined for the site-mean calculations (see text). Numbers in italics = identifiers of the five groups considered independent. Symbols with "X" = a colatitude value not used to calculate mean colatitude. Red solid squares = group mean colatitudes, horizontal bars = one standard deviation. Red dashed lines = the mean colatitude, gray vertical bar = 95% confidence limits.


![]()