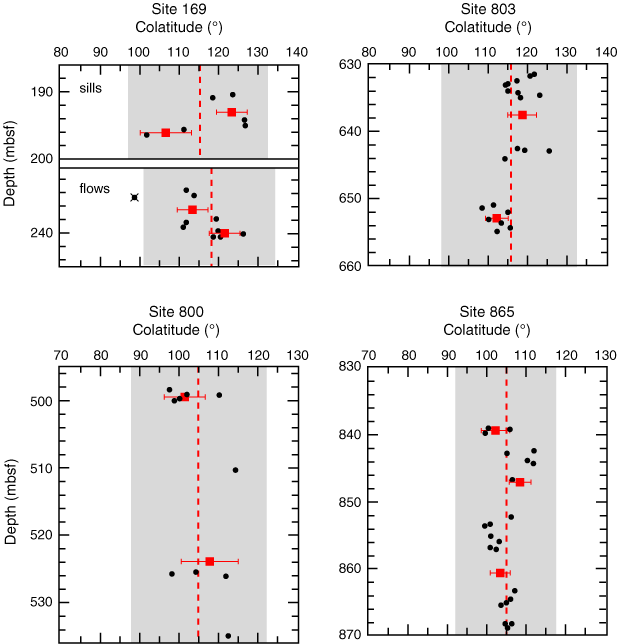
Figure F7. Colatitude data for Sites 169, 800, 803, and 865. The vertical axis in each plot = downhole depth, the horizontal axis = colatitude. The scales are identical in each plot. Solid circles = colatitude values (see Tables T1 and T5). Symbol with "X" = a colatitude value not used to calculate mean colatitude. Red solid squares = group mean colatitudes, horizontal bars = one standard deviation. Red dashed lines = the mean colatitude, gray vertical bars = 95% confidence limits.


![]()