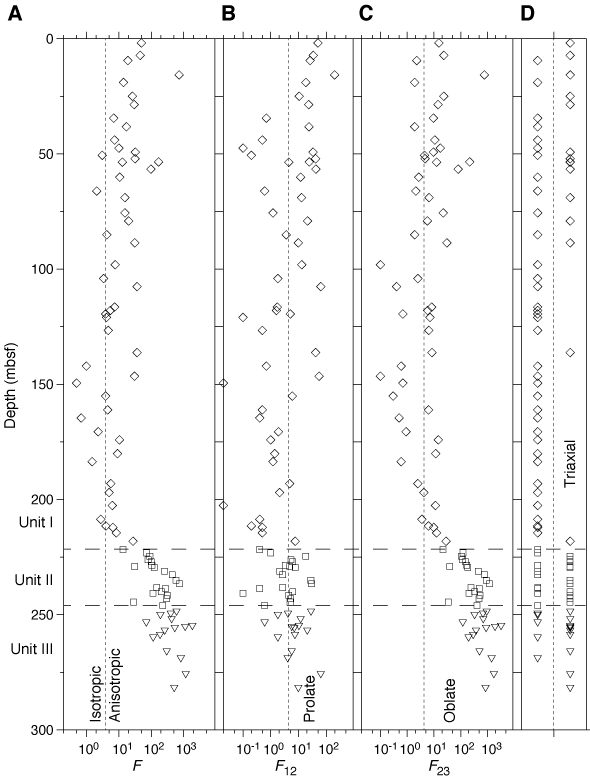
Figure F2. F-statistics for anisotropy vs. depth for samples listed in Table T3. A. F-statistic for isotropy/anisotropy; the threshold value for anisotropy is 3.84. B. F-statistic (F12) for prolate/triaxial AMS ellipsoids; the threshold value for a prolate or triaxial ellipsoid is 4.25. C. F-statistic (F23) for oblate/triaxial AMS ellipsoids; the threshold value for an oblate or triaxial ellipsoid is 4.5. D. If both F12 and F23 are greater than 4.25, the AMS ellipsoid is triaxial; symbols to the right of the dashed line indicate triaxial AMS ellipsoids.