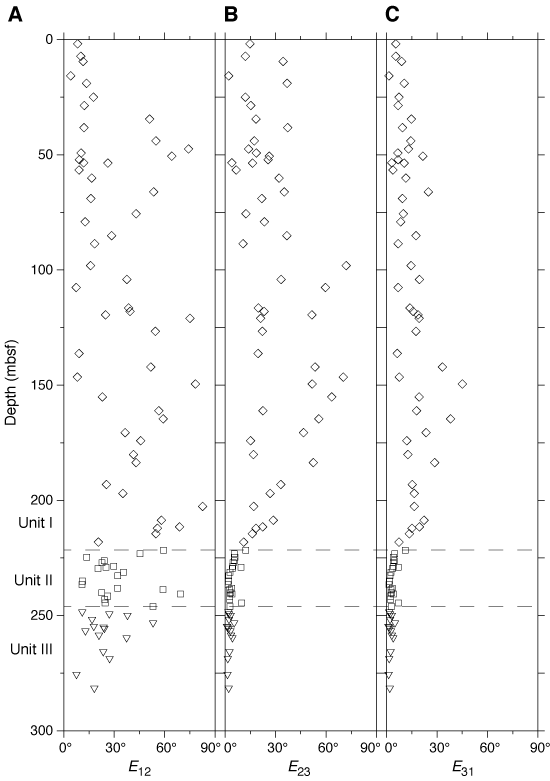
Figure F4. Variation in 95% confidence angles about the principal anisotropy axes vs. depth for samples listed in Table T3. A. E12, the 95% confidence angle between the Kmax and Kint anisotropy axes. B. E23, the 95% confidence angle between the Kint and Kmin anisotropy axes. C. E31, the 95% confidence angle between the Kmin and Kmax anisotropy axes.


![]()