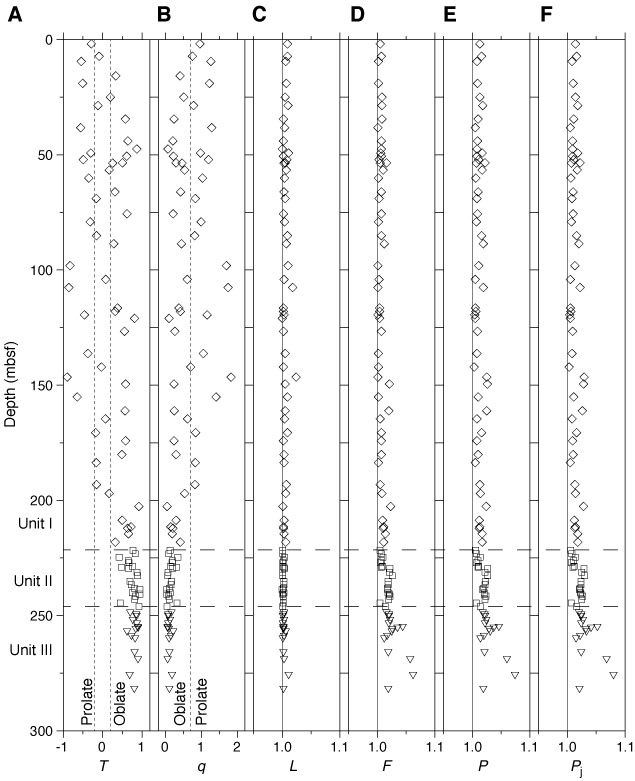
Figure F6. Anisotropy measures vs. depth for samples from Holes 1179B and 1179C. All parts of this figure use diamonds to show samples from sedimentary Unit I, squares to show samples from Unit II, and triangles to show samples from Unit III. A. Ellipsoid shape parameter T vs. depth; vertical dashed lines mark the boundaries for prolate and oblate AMS ellipsoids. Prolate ellipsoids are approximately cigar shaped, with Kmax inclination closest to 90°; oblate ellipsoids are approximately pancake shaped, with Kmin inclination closest to 90°. B. Ellipsoid shape parameter q vs. depth; vertical dashed line marks the boundary between oblate and prolate anisotropy of magnetic susceptibility ellipsoids.
C-F. Anisotropy measures L, F, P, and Pj vs. depth; in all cases 1.0 is isotropic.