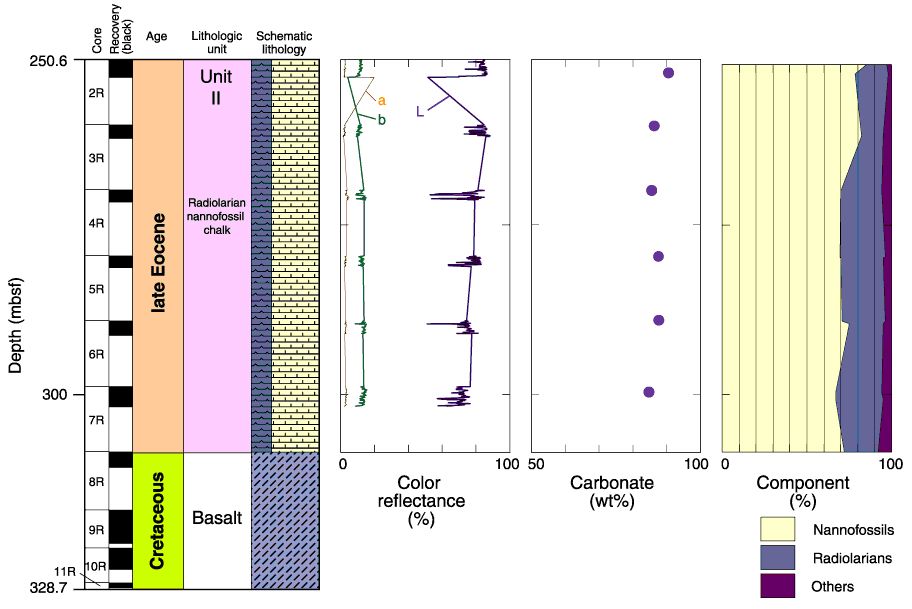
Figure F25. Hole 1185A log showing core recovery, lithostratigraphic divisions, schematic lithology, color reflectance, carbonate content, and components of sediments. In the color column, L = the total reflectance and indicates lighter shades to the right; a and b quantify the hue as chromaticity, where a = variation between green (low percent values) and red (high percent values) and b = variation between blue (low percent values) and yellow (high percent values) (Blum, 1997). Component percentages are from observation of smear slides and thin sections.

![]()