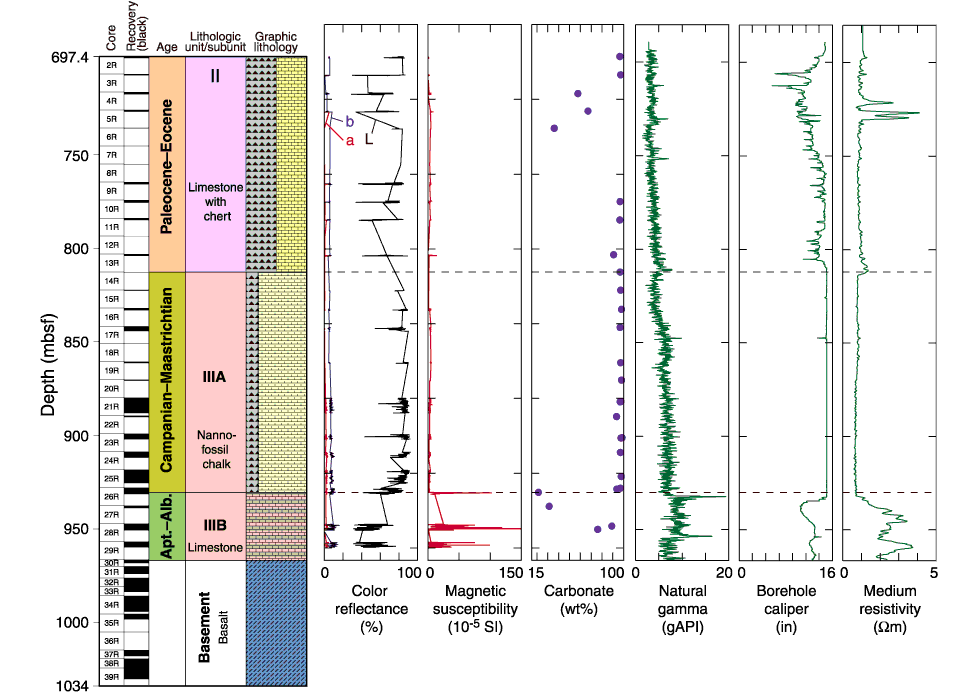
Figure F30. Lithologic log and selected properties of sediments at Site 1186. The interval from 0 to 697.4 mbsf was not cored. In the color column, L = the total reflectance and indicates lighter shades to the right; a and b quantify the hue as chromaticity, where a = the variation between green (low percent values) and red (high percent values) and b = the variation between blue (low percent values) and yellow (high percent values) (Blum, 1997). Higher values of magnetic susceptibility generally correlate with bands rich in volcanic ash (e.g., Core 192-1186A-13R) or with claystone (e.g., Core 192-1186A-26R and base of sedimentary sequence in Core 192-1186A-30R). Natural gamma radiation intensity is from the Formation MicroScanner tool run; medium-penetration resistivity and caliper of borehole diameter are from the geophysical tool run.

![]()