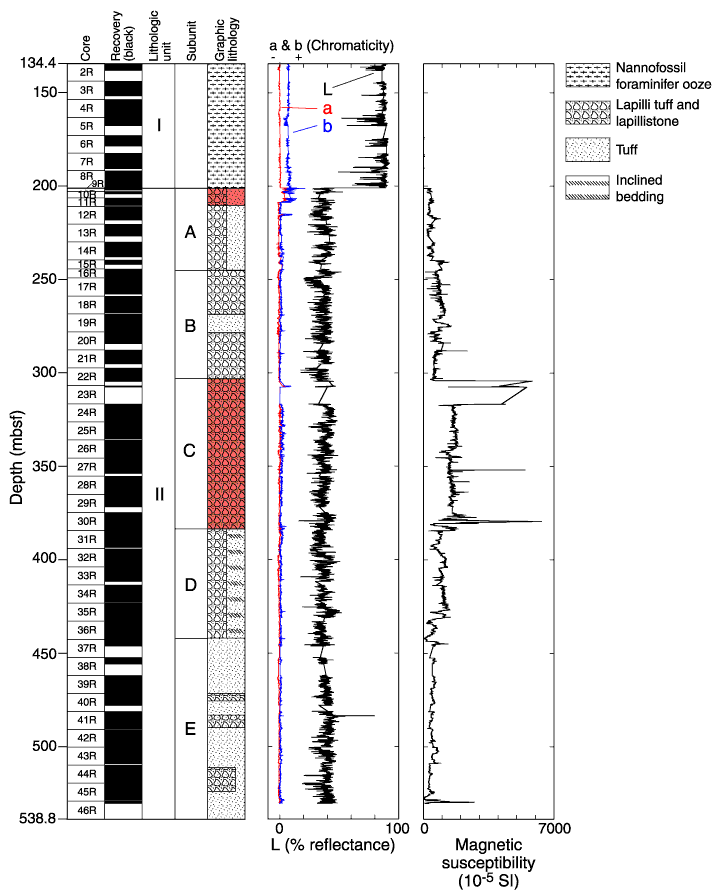
Figure F10. Core recovery (in black), lithostratigraphic divisions, schematic lithology, color, and magnetic susceptibility from Hole 1184A. For color, L is the total reflectance and indicates lighter shades to the right; a and b quantify the hue as chromaticity, where the a-axis shows variation between green (negative) and red (positive) and the b-axis shows variation between blue (negative) and yellow (positive). Red shading in the Graphic lithology column indicates red or yellow oxidized intervals.

![]()