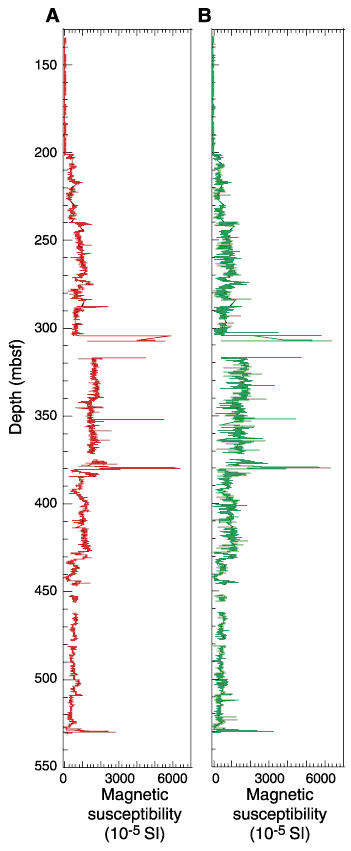
Figure F77. Magnetic susceptibility profiles obtained from (A) whole-core multisensor track (MST) measurements on the Bartington meter at 4-cm intervals and (B) split-core-section archive multisensor track (AMST) measurements on the point-susceptibility meter at 2-cm intervals.

![]()