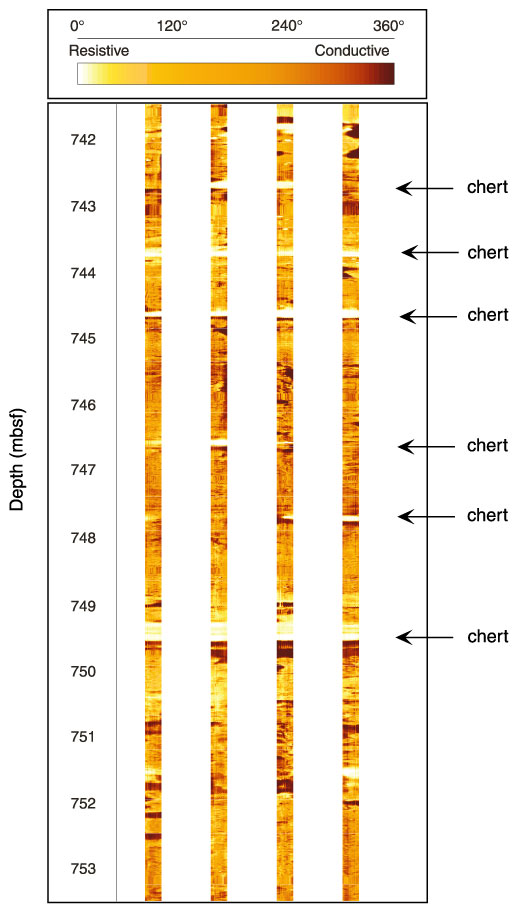
Figure F13. FMS image (from 741.5 to 753.5 mbsf) displaying chert horizons within Paleocene-Eocene limestone of lithologic Unit II. The FMS measures electrical microresistivity, and the range of values has been normalized over a sliding window (dynamically processed) and color-enhanced to accentuate lithologic contrasts.
![]()