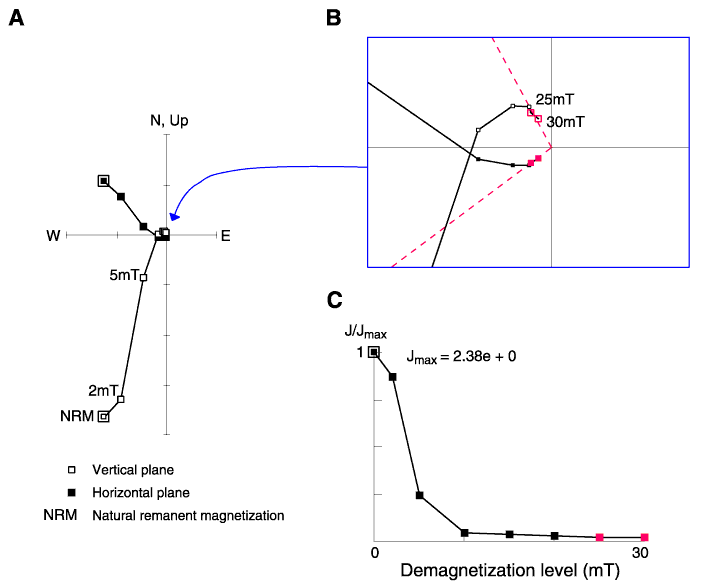
Figure F52. A. AF demagnetization of a sample (192-1186A-39R-1 [Piece 1, 6 cm]) severely overprinted by drilling-induced magnetization. B. Enlargement of the Zijderveld diagram. The dashed red lines represent the ChRM direction defined by principal component analysis. C. Decay of natural remanent magnetization during AF demagnetization. Note that only a few percent of NRM remains at the 20- and 25-mT demagnetization steps that define the ChRM.

![]()