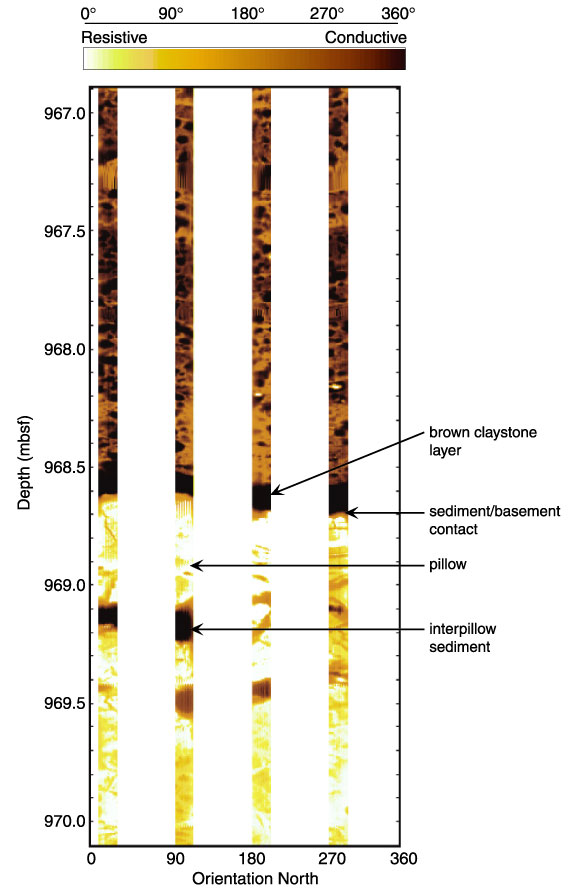
Figure F57. FMS image (from 967 to 970 mbsf) displaying the transition between Aptian-Albian limestone of lithologic Unit III (Subunit IIIB) and basalt of basement Unit 1. The FMS measures electrical microresistivity, and the range of values has been normalized over a sliding window (dynamically processed) and color-enhanced to accentuate lithologic contrasts.
![]()