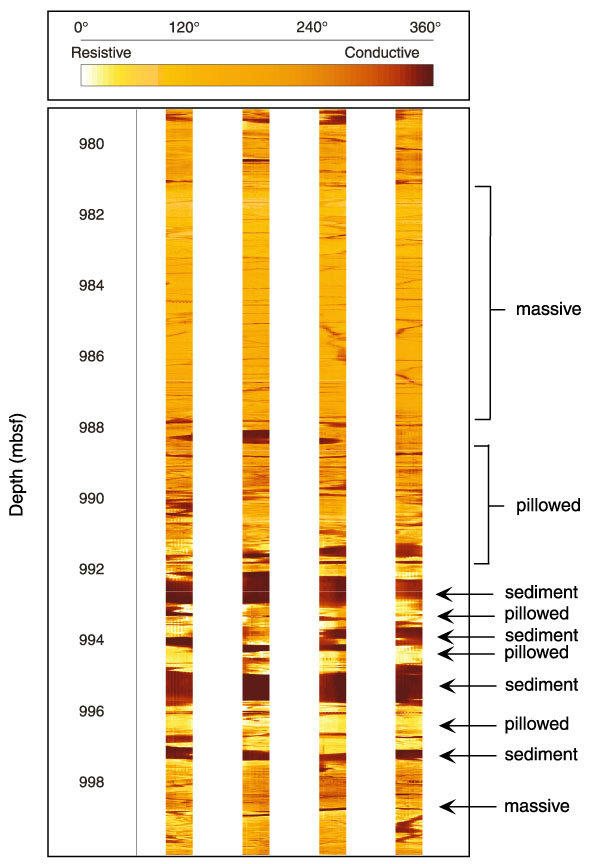
Figure F61. FMS image (from 979 to 999.5 mbsf) displaying massive (basement Unit 2) and pillow basalt, sedimentary interbeds, and another massive interval (basement Unit 3). The FMS measures electrical microresistivity, and the range of values has been normalized over a sliding window (dynamically processed) and color-enhanced to accentuate lithologic contrasts.
![]()