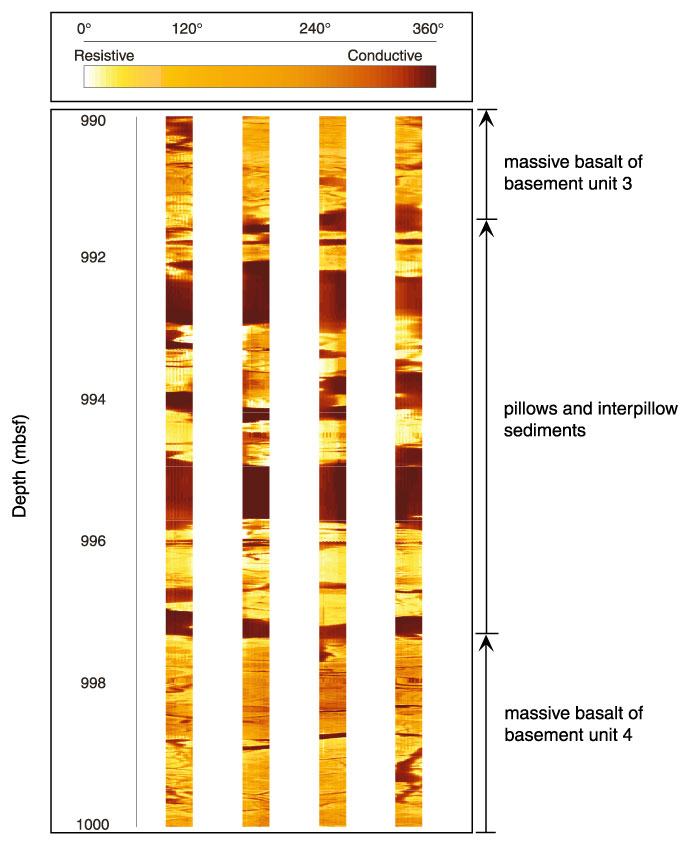
Figure F62. FMS image (from 990 to 1000 mbsf) highlighting sedimentary interbeds (dark) between pillow basalt of basement Unit 3. The FMS measures electrical microresistivity, and the range of values has been normalized over a sliding window (dynamically processed) and color-enhanced to accentuate lithologic contrasts.
![]()