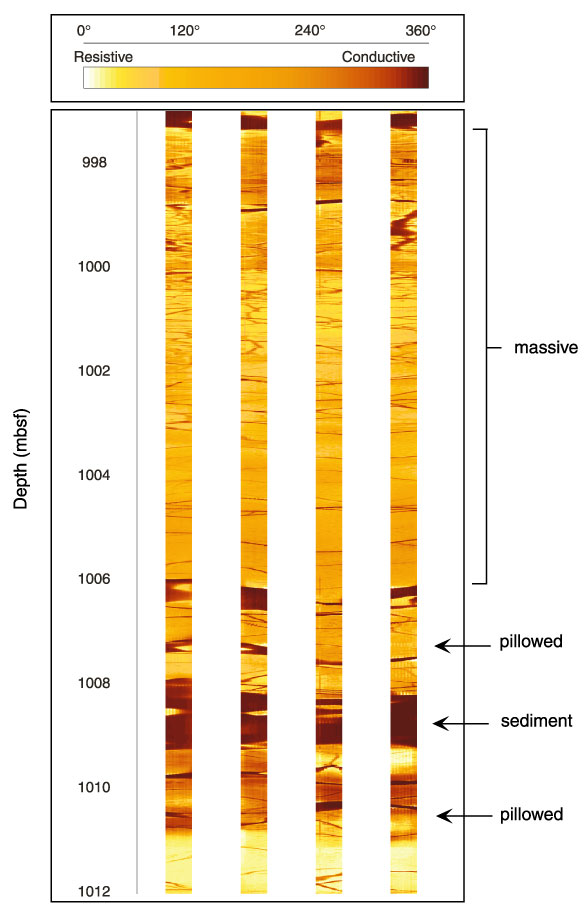
Figure F63. FMS image (from 997 to 1012 mbsf) showing a massive interval (basement Unit 3), pillow intervals, and a sedimentary interbed (basement Unit 4). The FMS measures electrical microresistivity, and the range of values has been normalized over a sliding window (dynamically processed) and color-enhanced to accentuate lithologic contrasts.
![]()