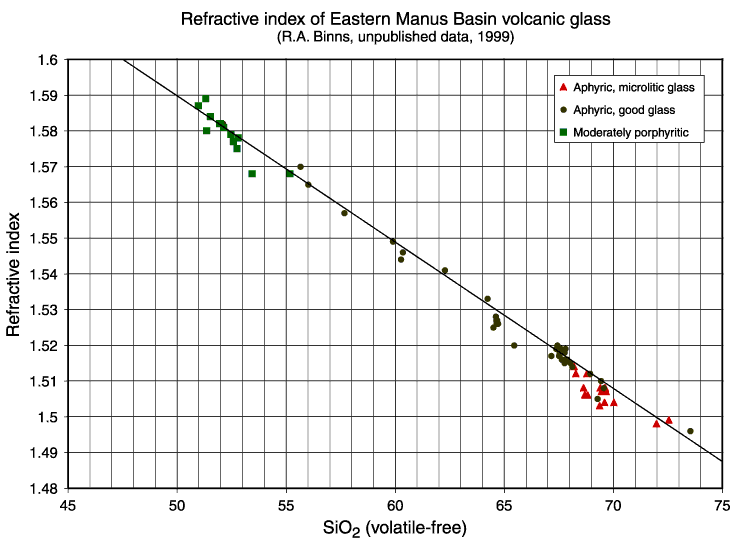
Figure F3. Calibration curve used during Leg 193 to estimate the glass compositions (bulk silica content, recalculated volatile free; based on dredged samples from PACMANUS cruises, 1991-1997; R.A. Binns, pers. comm., 2000). As much as 20% of microlites or phenocrysts do not seriously affect the use of the diagram, although some judgement might be required at the dacite-rhyodacite boundary (70% SiO2).
![]()