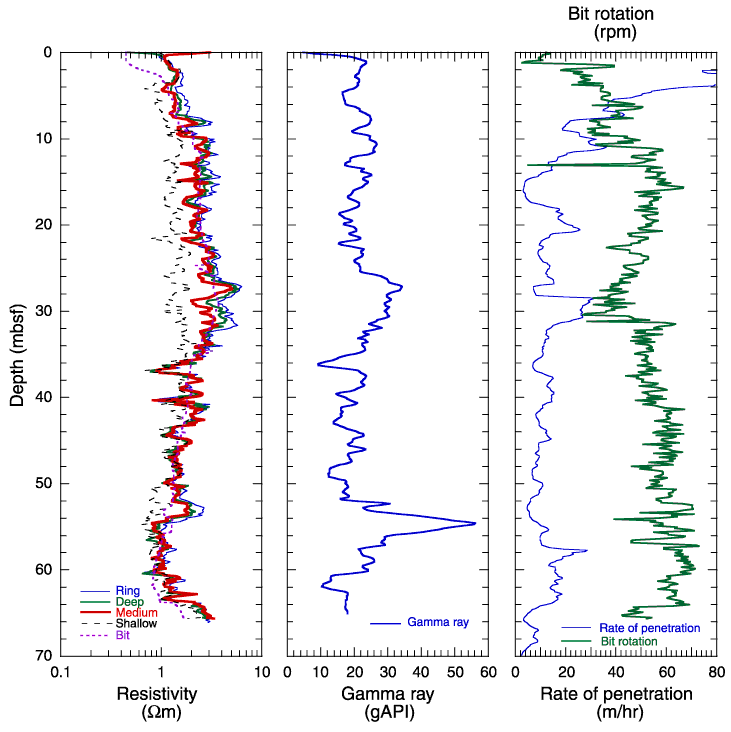
Figure F139. Log curves obtained from the resistivity-at-the-bit (RAB) tool in Hole 1188B. The left panel shows five logs of electrical resistivity with different depths of investigation and vertical resolution. In the middle, the gamma-ray log is displayed. The right plot exhibits the rate of penetration and bit rotation.

![]()