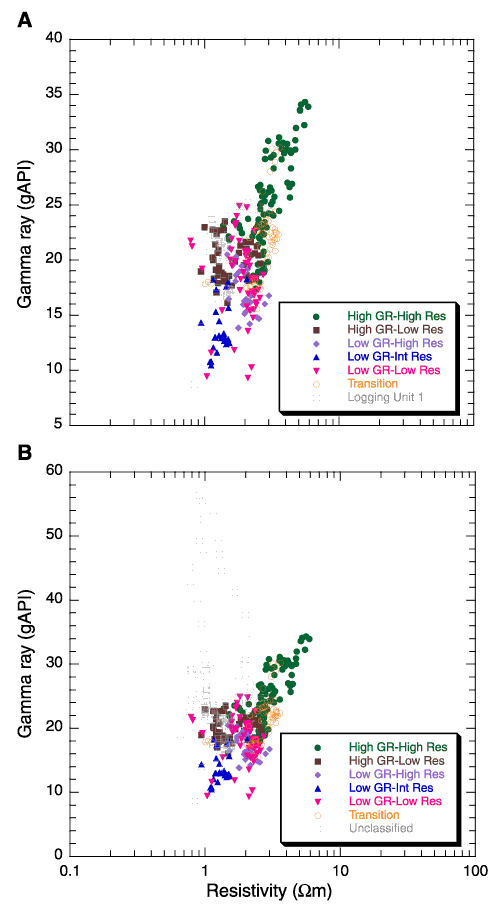
Figure F141. A. Covariation of electrical resistivity vs. gamma ray showing the different logging units displayed in Figure F140 with the exception of logging Unit 10. The relationship between resistivity and gamma ray shows a good correlation for most of the logging units in Hole 1188B. B. A similar covariation diagram including data from logging Unit 10, which shows large variability within this 11-m-thick zone.

![]()