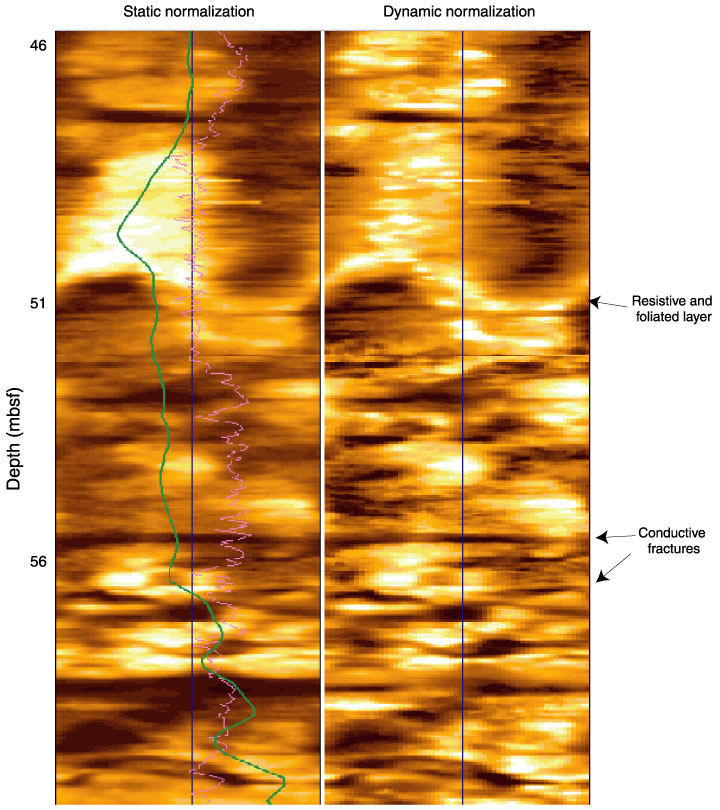
Figure F152. Resistivity-at-the-bit static and dynamic images of Hole 1189C showing subhorizontal fractures and various resistive features. The green line (low-frequency fluctuation) in the static column is the gamma-ray log. The pink line (high-frequency fluctuation) is the bit-rotation speed log.
![]()