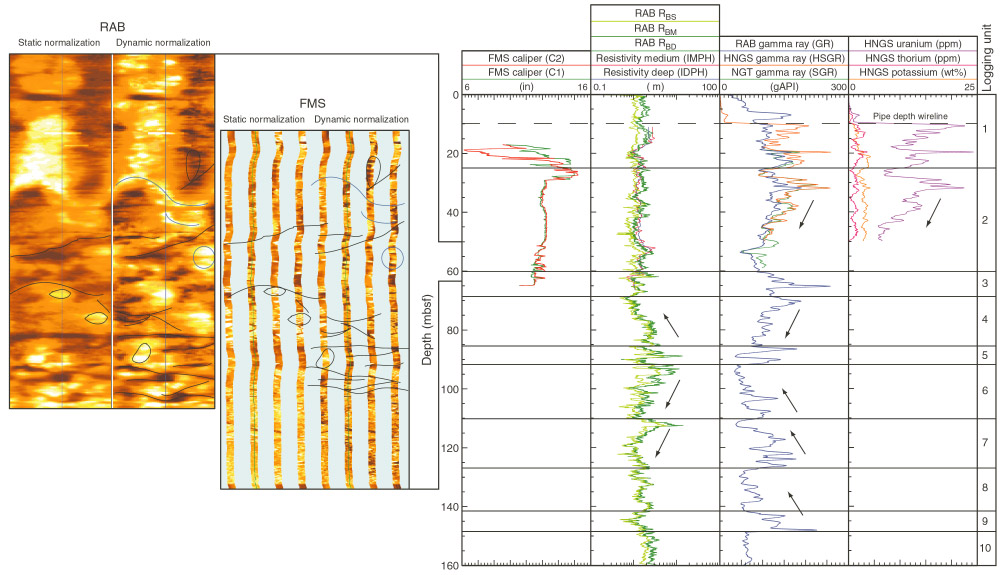
Frontispiece. A comparison between logging-while-drilling (LWD) resistivity-at-the-bit (RAB) and wireline log data from the first Ocean Drilling Program deployment of the RAB tool. The measurements obtained in Hole 1189C provide electrical images of the borehole wall (on left) and log curves of electrical resistivity and natural radioactivity (on right). The LWD data (images, deep-, medium-, and shallow-button resistivity curves, and gamma-ray profile) show fracture patterns, alteration trends (denoted by arrows), and high gamma-ray values that may be indicative of hydrothermal fluid flow along fractures. The wireline logging data were collected only in the upper 65 m because of a hole obstruction, emphasizing the value of obtaining LWD data before deterioration of borehole conditions. The Formation MicroScanner (FMS) calipers show the size of the borehole in the upper sections after LWD operations were completed. The wireline spectral gamma-ray data show the correlation between high gamma- ray values (RAB and wireline) and high uranium concentrations (wireline). The RAB data also show a rapid increase in gamma-ray values from the seafloor to ~6 m below seafloor (mbsf) that is not present in the wireline logs (because of the location of the drill pipe at 10 mbsf) or in the core data and most likely corresponds to the presence of hydrothermal deposits. Fracture patterns correlate well between the full 360° coverage RAB and the higher-resolution (<20% borehole coverage) FMS oriented images. In addition, because of relatively low core recovery, the LWD logs provide the only continuous record of the lithostratigraphic sequences drilled in the Manus Basin. RBS = shallow resistivity, RBM = medium resistivity, RBD = deep resistivity, IMPH = medium induction phasor-processed resistivity, IDPH = deep induction phasor-processed resistivity, HNGS = hostile-environment natural gamma-ray sonde, HSGR = total spectral gamma ray, NGT = natural gamma-ray tool, SGR = standard gamma ray.