![]() Figures
F1-F8
Figures
F1-F8
![]() Table T1
Table T1
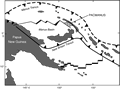
F1. Location of the PACMANUS hydrothermal field.
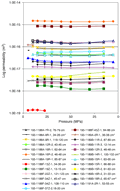
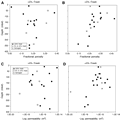
F2. Permeability measurements for samples with little response to pressure.
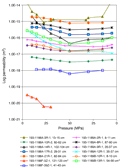
F3. Permeability measurements for samples with a large response to pressure.
F4. Permeability vs. depth.
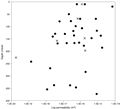
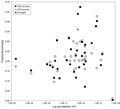
F5. Permeability vs. porosity.
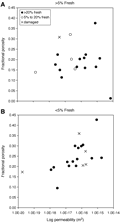
F6. Porosity and permeability vs. depth.
F7. Porosity vs. permeability.
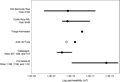
F8. Comparison of core-scale permeability.
T1. Physical properties of samples.