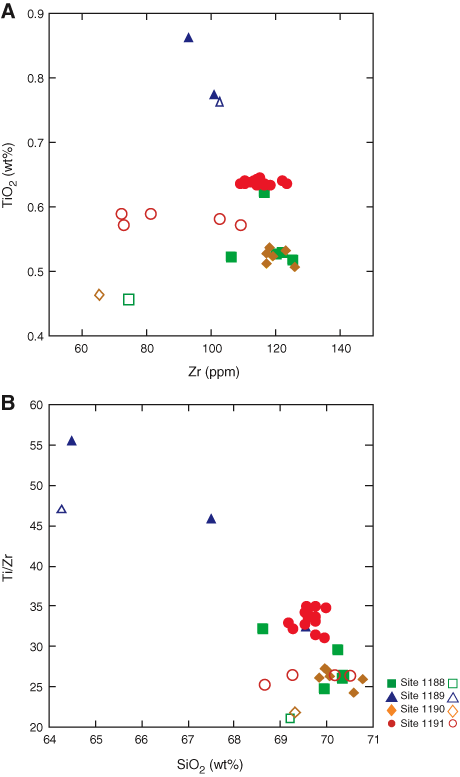
Figure F9. A. Covariation diagram of TiO2 vs. Zr in fresh lavas from the crest of Pual Ridge showing a distinct fractionation trend. The sample with anomalously low Zr (106 ppm) at 0.5 wt% TiO2 has a sample taken from 2 cm away with 125 ppm Zr and 0.5 wt% TiO2 that plots on the best-fit trend line. B. Covariation diagram of SiO2 vs. Ti/Zr in fresh lavas from the crest of Pual Ridge showing a fractionation trend. Elevated Ti/Zr may be a result of incipient alteration. Solid symbols = this study, open symbols = shipboard analyses.


![]()