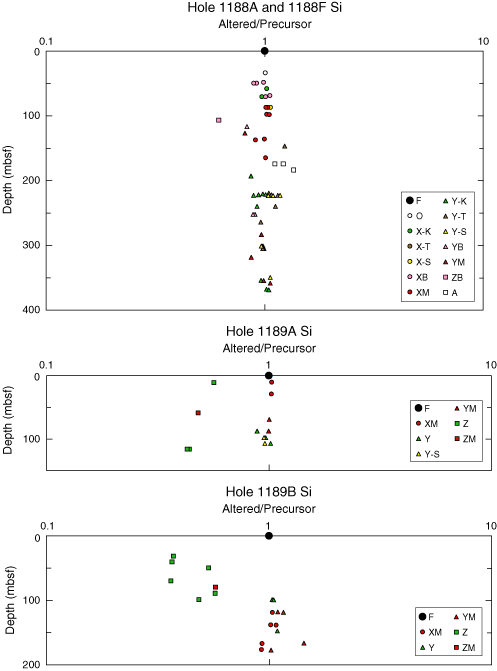
Figure AF2. Downhole profiles at Sites 1188 and 1189 for the ratio of Si content in altered volcanic samples to that in their precursors (plotted logarithmically and computed as described in the "Appendix"). Symbols denote petrographic categories set out in Table
T1 (assessed from macroscopic, XRD, and petrographic examination). Only relatively homogeneous subsamples analyzed at CSIRO are plotted. The "fresh" symbol is plotted at unity ratio and zero depth for added clarity.


![]()