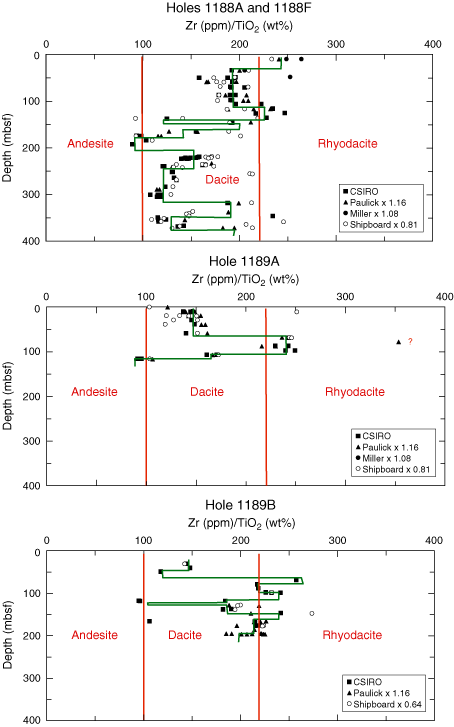
Figure F5. Profiles of Zr/TiO2 ratios in altered volcanic rocks from Sites 1188 and 1189 at PACMANUS, plus unaltered caprocks at the tops of Holes 1188A and 1189A. Boundaries between andesite, dacite, and rhyodacite (red vertical lines) derive from Figure
AF1. Plot lines (green) represent a conservative interpretation of the data in terms of a sequence of lavas with differing composition. Original data from Paulick et al. (this volume), Miller et al. (this volume), and shipboard analyses (Binns, Barriga, Miller, et al., 2002) plot as parallel, very similar profiles displaced laterally relative to unpublished CSIRO ratios (analyzed by the same methods as for Fig.
AF1). Here they are adjusted for interlaboratory calibration differences as indicated; factors were calculated from duplicated analyses of individual or nearby similar samples (both altered and fresh), plus comparative data for two Leg 193 reference standards (Miller et al., this volume). For the shipboard analyses it was necessary to assume a "batch difference" for the Zr analyses from Hole 1189B, and thus a different adjustment factor relative to shipboard analyses from other holes.