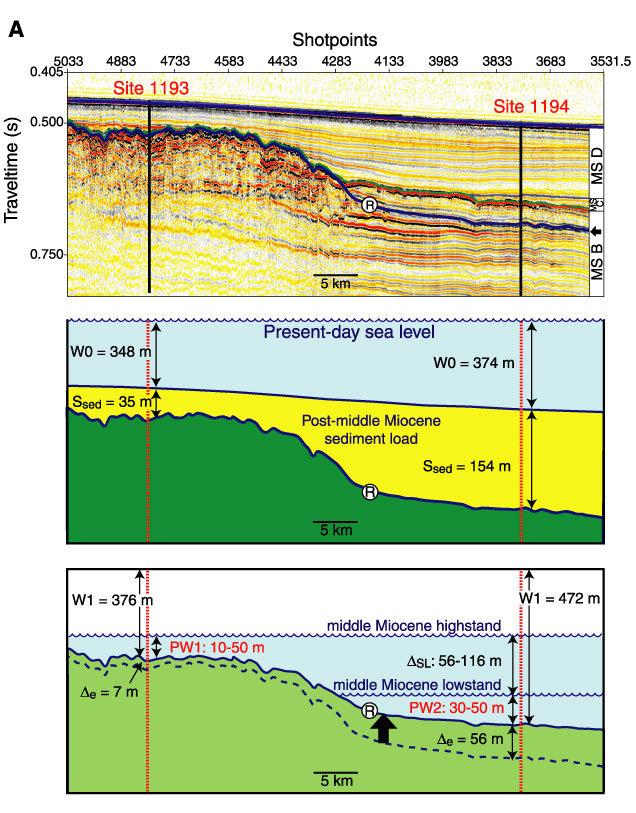
Figure F14. A.
Diagram illustrating the calculation of the late middle Miocene eustatic fall
using Sites 1193 and 1194, assuming infinite crustal strength (no differential
subsidence) between the sites. The top panel displays the relevant seismic
sequences on seismic line MAR13. The onlapping unit at Site 1194, below the
Megasequence B/C boundary and above the onlap surface labeled R (sequence
boundary; see arrow), was deposited during the middle Miocene lowstand, which
exposed the platform top at Site 1193. The middle panel is a schematic
presentation of the present-day configuration. The lower panel shows the
geometric adjustment of the relevant sequence boundary (R) as a result of
sediment expansion after removal of the post-middle Miocene sediment load. W1 =
present day water depth, S = thickness of post-middle Miocene sediment load, PW
= paleowater depth estimated from biotic assemblage,  e
= sediment expansion (reduced water depth), SL
= magnitude of eustatic fall. B. Diagram illustrating the calculation of
the late middle Miocene eustatic fall using Sites 1193 and 1194, assuming zero
flexural strength between the sites (i.e., local isostatic compensation at each
site). Refer to the top two panels in Figure F14A for seismic line and schematic representation of the present-day
configuration. The top panel illustrates geometric adjustments to sediment
unloading (isostatic and sediment expansion). The middle panel shows the water
depths adjustment for the middle Miocene highstand condition. The bottom panel
shows the final adjustment for the middle Miocene low-stand parameters. W3 and
W4 = reconstructed water depths, m = amounts of isostatic rebound, SL1 = total
sea level fall required for middle Miocene highstand paleowater depth PW1, SL2
= eustatic fall required for middle Miocene lowstand paleowater depth PW2.
e
= sediment expansion (reduced water depth), SL
= magnitude of eustatic fall. B. Diagram illustrating the calculation of
the late middle Miocene eustatic fall using Sites 1193 and 1194, assuming zero
flexural strength between the sites (i.e., local isostatic compensation at each
site). Refer to the top two panels in Figure F14A for seismic line and schematic representation of the present-day
configuration. The top panel illustrates geometric adjustments to sediment
unloading (isostatic and sediment expansion). The middle panel shows the water
depths adjustment for the middle Miocene highstand condition. The bottom panel
shows the final adjustment for the middle Miocene low-stand parameters. W3 and
W4 = reconstructed water depths, m = amounts of isostatic rebound, SL1 = total
sea level fall required for middle Miocene highstand paleowater depth PW1, SL2
= eustatic fall required for middle Miocene lowstand paleowater depth PW2.