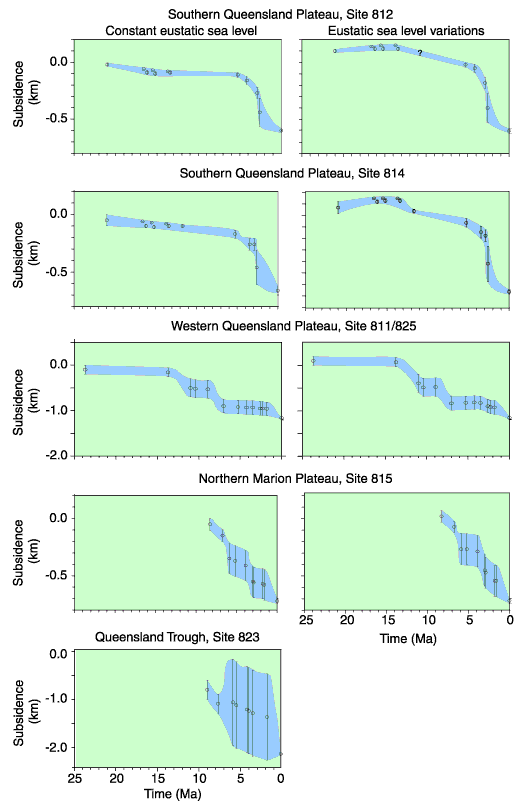
Figure F4.
Water-loaded tectonic subsidence (i.e., with the isostatic sediment load
removed) for ODP Leg 133 Sites 812, 814, 811/825, 815, and 823, assuming
constant eustatic sea level (shown on left) and using eustatic sea level
variations of Haq et al. (1987) (shown on right). The latter is not shown for
Site 823, as the errors in water depth (vertical error bars) are much larger
than eustatic sea level variations. Shading around error bars indicates the area
in which the true subsidence curve should occur. Comparisons between constant
and varying eustatic sea levels allow evaluation of the potential effect of
eustatic variations on tectonic subsidence models. For instance, the first model
(left) for Site 814 shows a gently subsiding platform until ~5 Ma, whereas the
second model (right), including eustasy, shows a tectonic subsidence pulse
between 14 and 12 Ma. Therefore, the latter may be entirely due to the input of
an ill-constrained eustatic sea level curve.


![]()