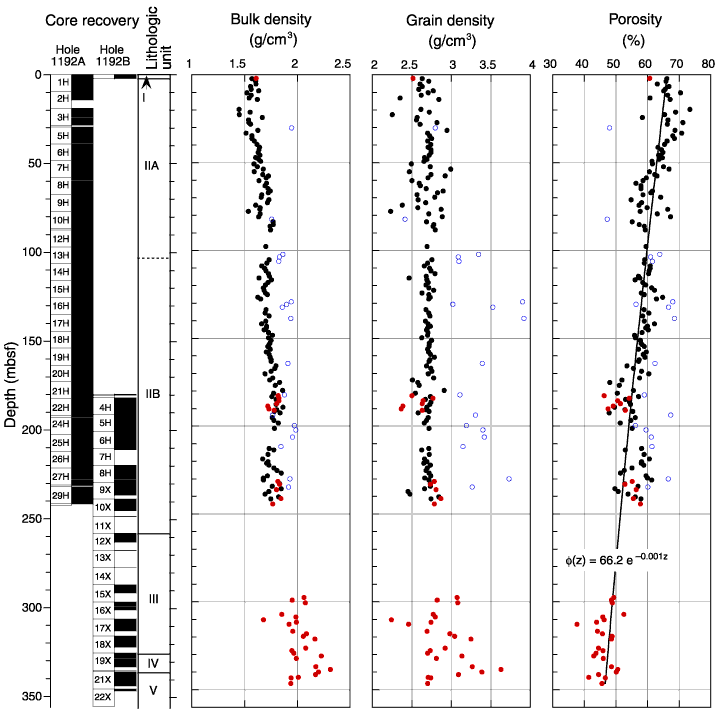
Figure F22. Bulk density, grain density, and porosity as a function of depth at Site 1192. Exponential least-squares regression of porosity using the combined Holes 1192A and 1192B data set is shown superposed on the porosity. Black circles = Hole 1192A data, gray circles = Hole 1192B data, open circles = data suspected of possible analytical error.


![]()