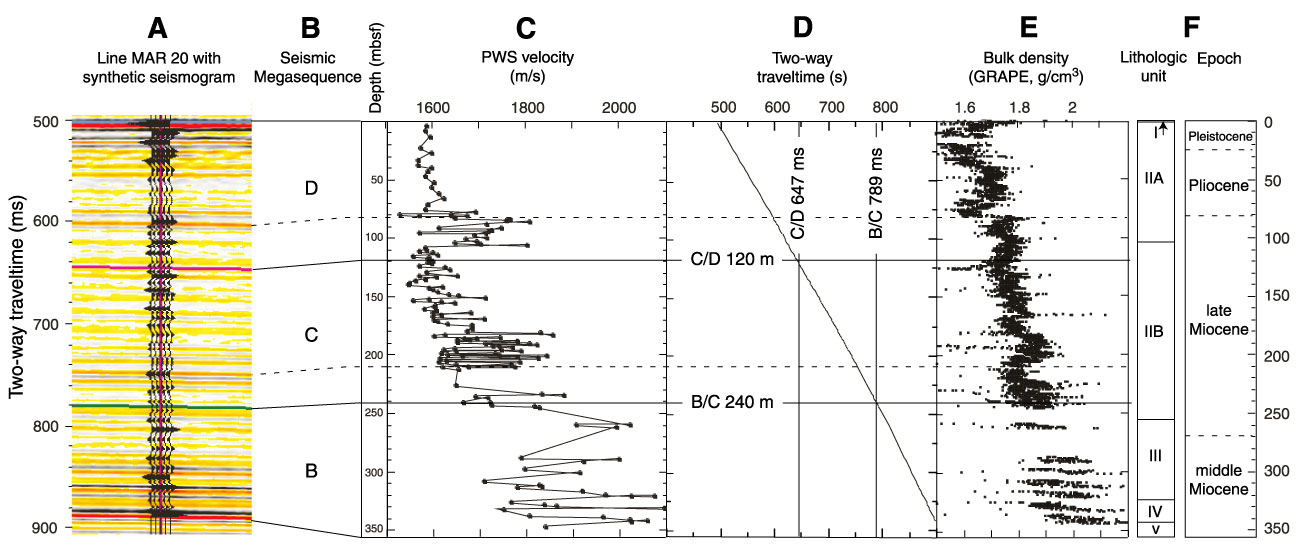
Figure F30. A.
Synthetic seismogram plotted on line MAR20. B. Seismic
megasequence definition. C. P-wave velocity data. D.
Two-way traveltime-to-depth conversion. E. Bulk density. F.
Lithologic units and ages. The traveltime-vs.-depth plot links seismic
reflection events to depth in the cores, as shown for positions of Megasequence
C/D and B/C boundaries. Dashed lines indicate high-amplitude reflections on line
MAR20 (see Fig. F29),
which coincide with prominent shifts in downcore density and velocity
measurements.